During the past year, with travel and cultural venues pretty much shut down, I found myself with significant amounts of time to investigate curiosities which normally would have remained nothing more than musings during the punishing LA
commutes. Like many people, my mailbox is filled with postcards from realtors touting their latest sale in the neighborhood. Those properties all seemed to have one thing in common, an ADU.
There has been a lot written about ADU's (accessory dwelling units, often referred to as "granny flats") over the last few years as one tool to help
alleviate the
California housing crisis. Every time I pick up a design magazine there seems to be a new company in the ADU market.
The City of LA has been a strong proponent of the ADU, exemplified by this KCRW profile of
a test project in northeast LA.
California recently changed state laws regarding ADU's in two rounds, the first taking effect in 2017 and the second in 2020. These laws created more uniform requirements for ADU construction across the state, effectively cleaning-up a
patchwork of regulations at local municipal levels.
Assembly Bill AB-2299 and Senate Bill SB-1069 were signed into law by Gavin Newsom in Sept of 2016 and then updated at the end of 2017 by SB-229 and AB-494. Here is an analysis of the overall effects of those bills on
the ADU
construction numbers in various cities in the state.
In 2019 five more bills were signed into law, going into effect on Jan 1, 2020: AB-881, AB-68, SB-13, AB-670, AB-671. The details of each are summarized nicely in this Forbes article.
All of this flurry around ADU's encouraged me to look for data sets that could be used for a predictive modeling project. On the LA City datahub I found what looked like a curated dataset of ADU permits issued or applied for during the six months between
July 1, 2017 and December 31, 2017. Taking my clues from the radio segment mentioned above, I soon realized that I would need to source data about building permits, parcel sizes, median incomes, historic preservation overlay zones and hillside
ordinances, and combine them all. I found what I needed in three locations - the LA City Datahub, the LA County Datahub and the US Census Bureau. The data ETL (extract, transform and load) became its own project and
its own post (see my post "Los Angeles City Civic Data").
Diving Into the Data
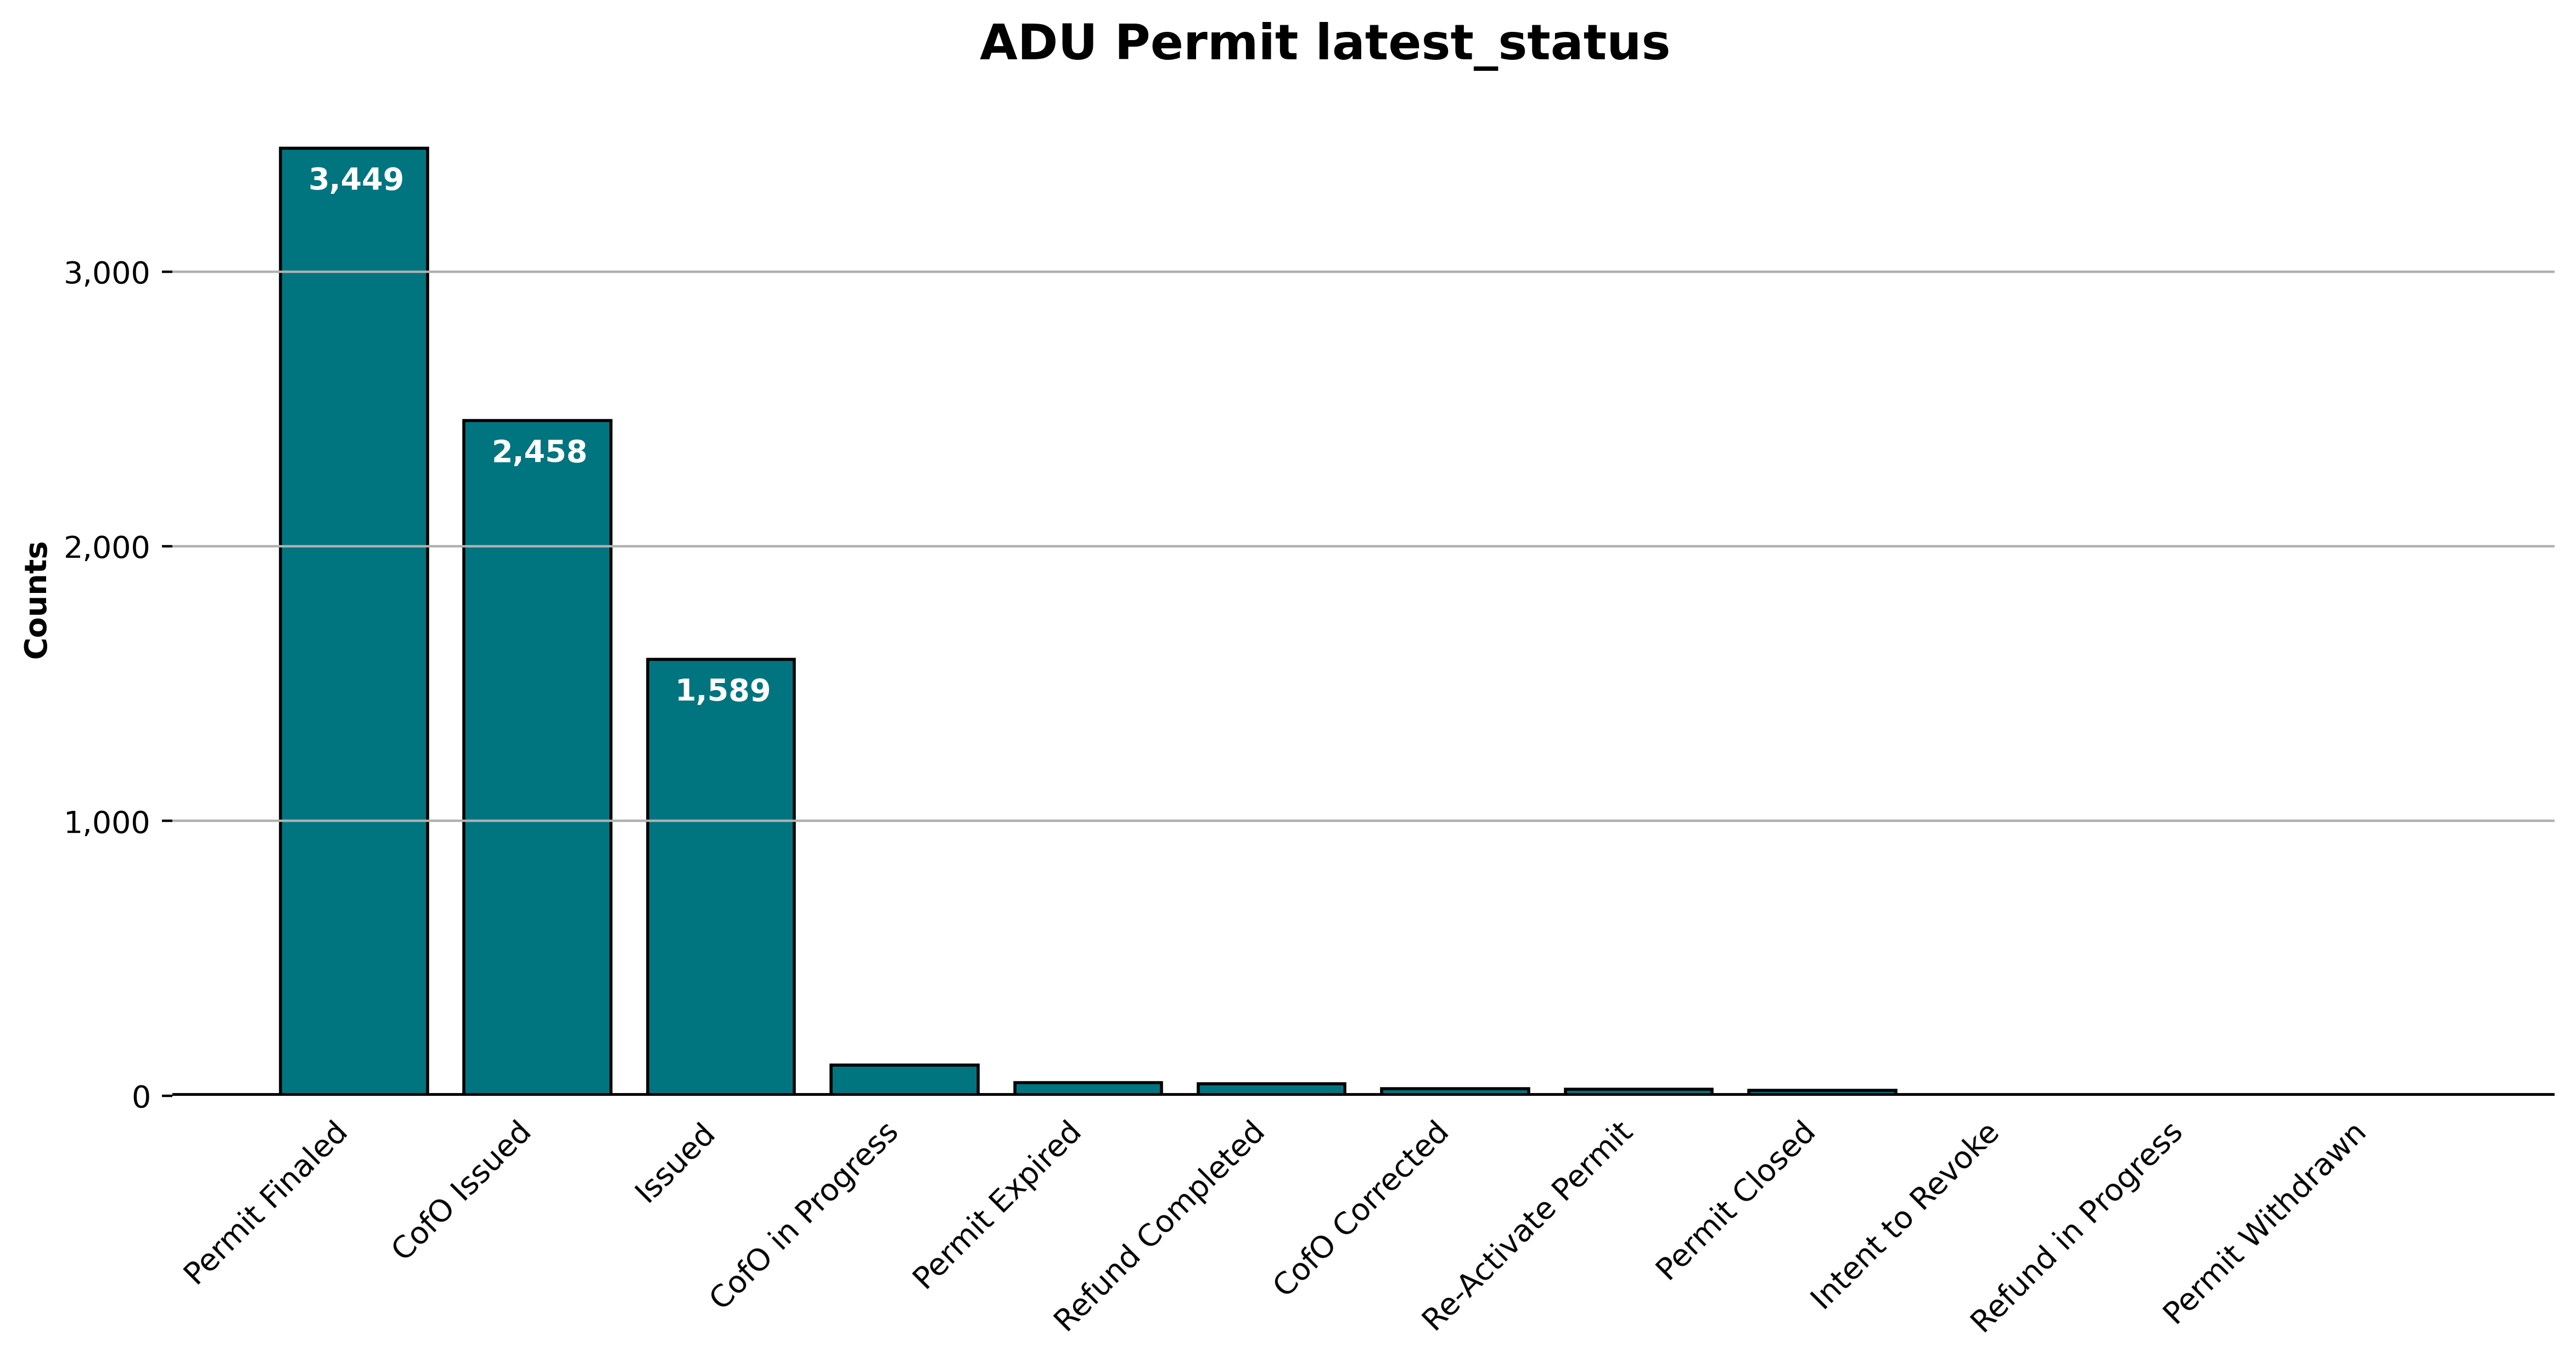
The details of this analysis can be found on my github repository for this project. The ADU data set maintained on the LA City Datahub consists of 7,778 records with 58 variables. For this analysis I considered a project as
complete if its `latest_status` variable became "CofO Issued." Once a project is finished a "Certificate of Occupancy" is issued to indicate that it is ready for human habitation. As of late March, the number of permits that reached this
status was 2,458, or 31.6% of 7,778 records. The remainder of the permits seem to be stuck in "Issued" or "Permit Finaled" categories. I'm interpreting this to mean that the project received its permit to build, but then
was never completed.
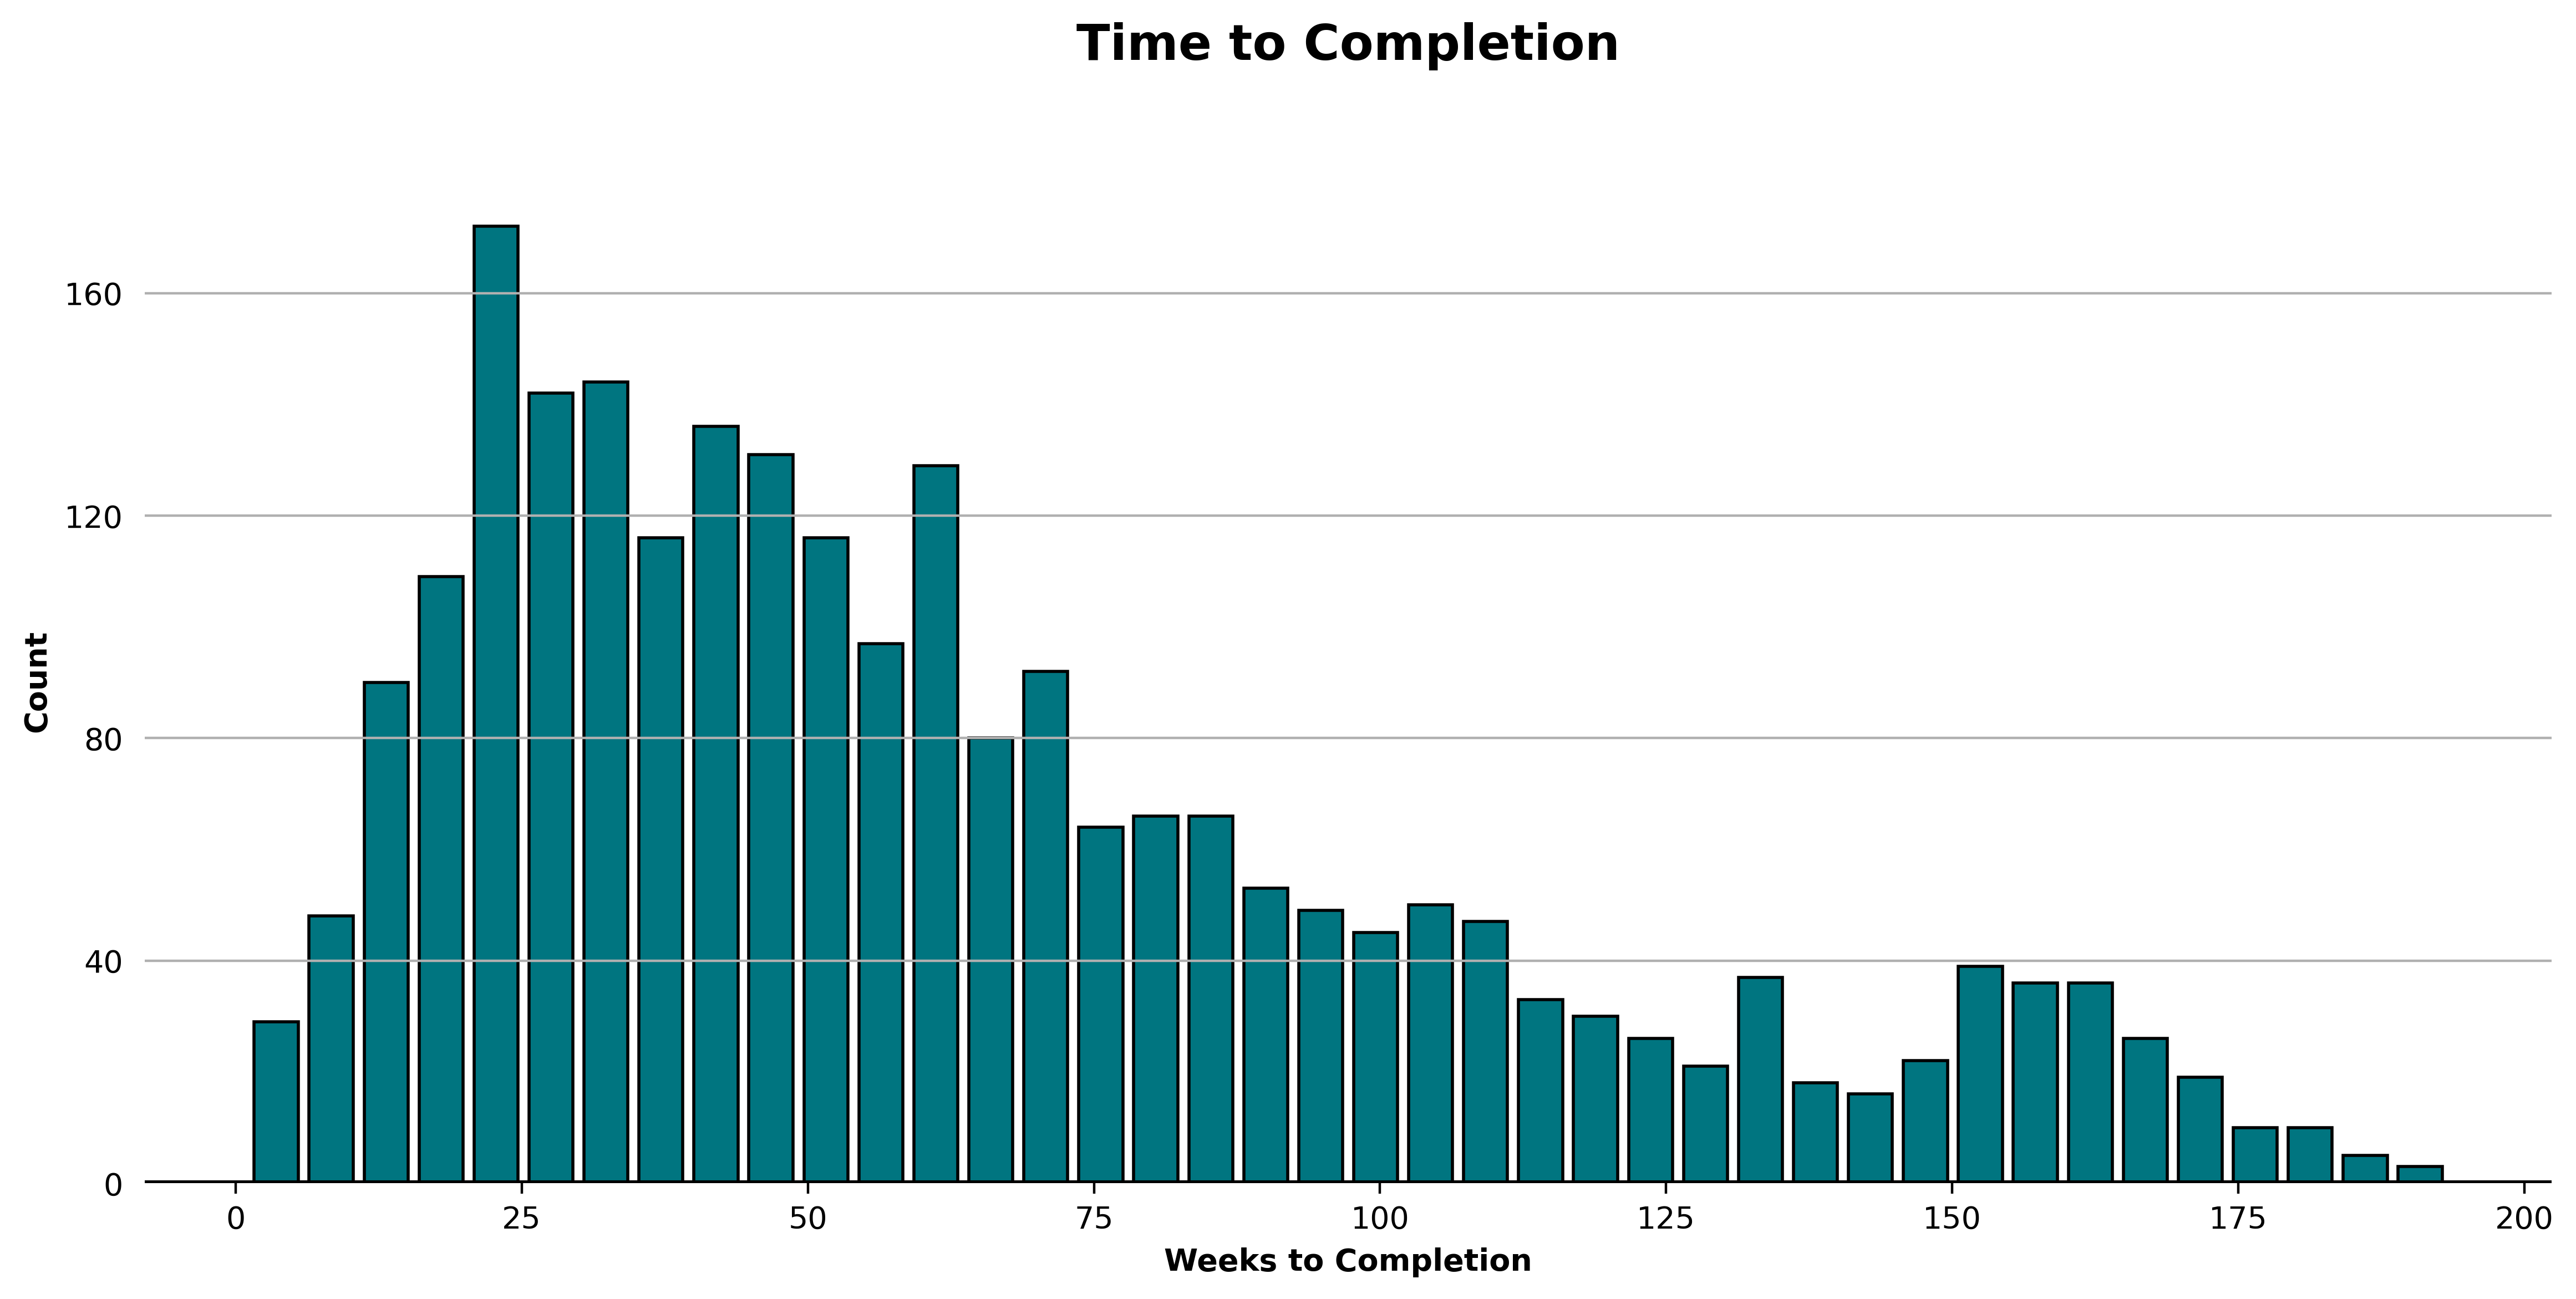
Given that almost three years has passed since these permits were issued or applied for it seems that most all of those that are going to be completed would have been by now. Some basic analysis of the time to completion shows that the most common time to
completion is about 24 weeks, or almost half a year.
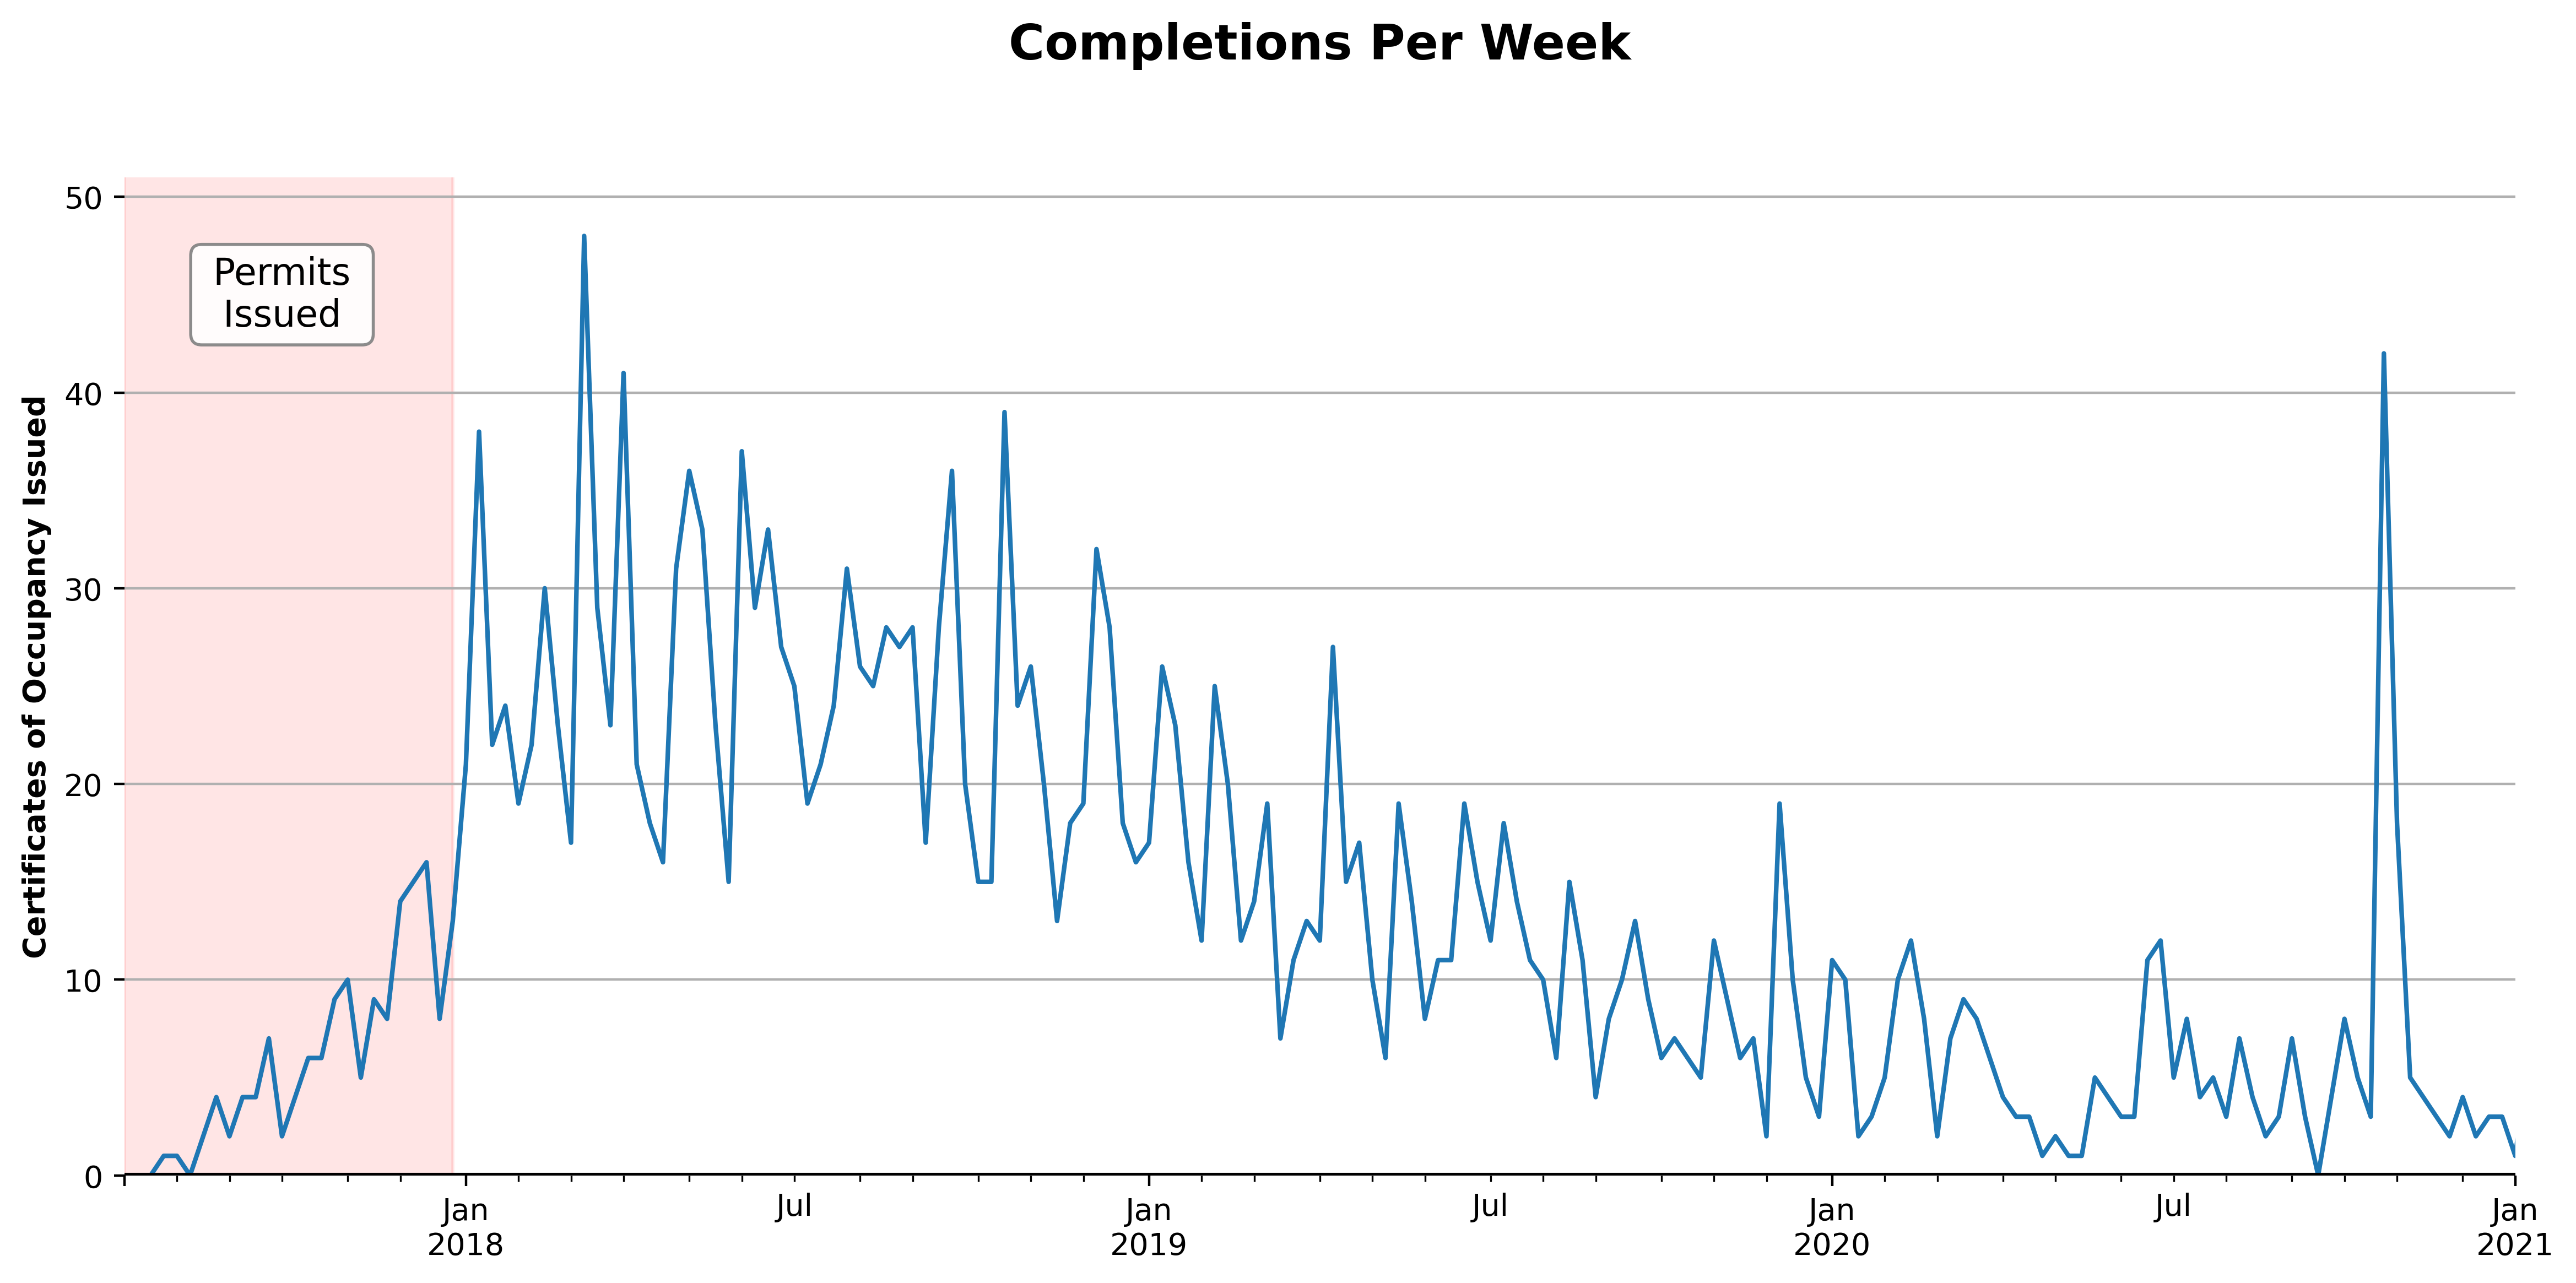
After then the rate of project completions steadily declines until it reaches a single digit amount per week for the most part, except for one week towards the end of 2020. Given the pandemic this could be due to a backlog of inspections that
were able to resume in the later half of the year. Since 2020 was such an unusual year, I decided to constrain my analysis to within two years from "issue_date". Thus the model will attempt to predict whether a
project, once
permitted, will reach completion within two years.
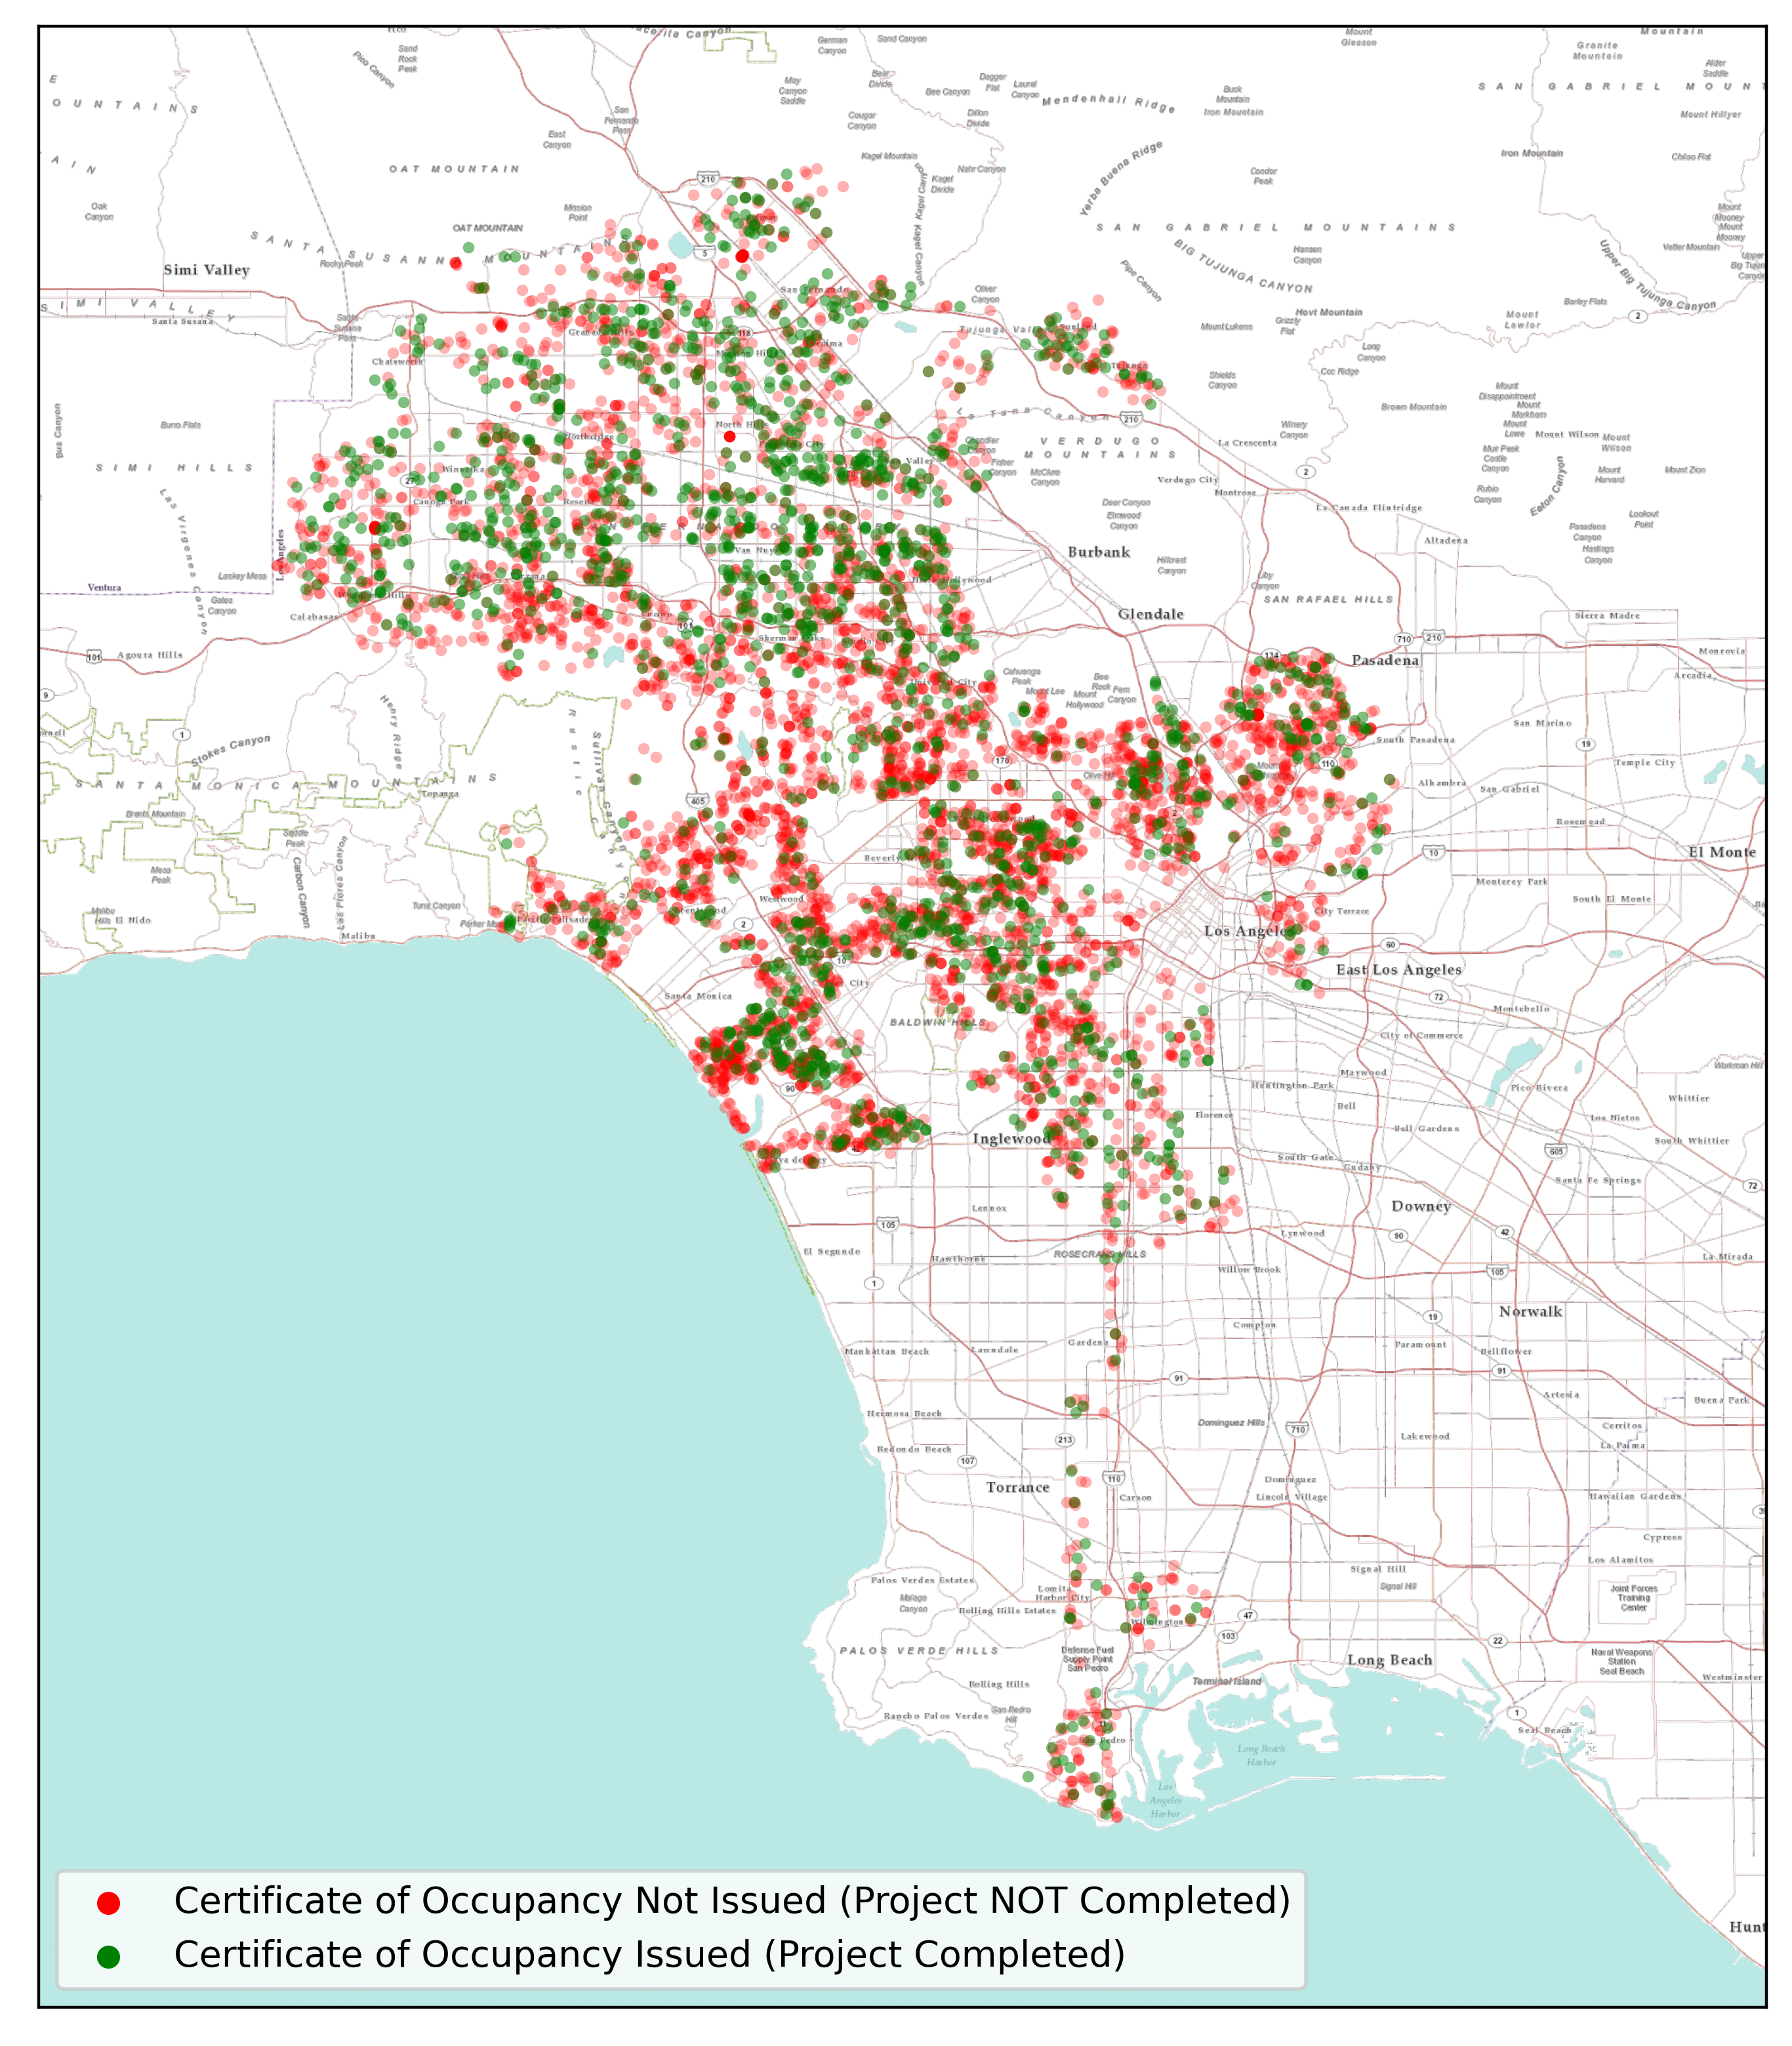
Six months after the passage of state laws which eased restrictions on ADU construction in 2017, we see project permitting was in full swing in all parts of the city. The density seems a bit higher in the central regions, and the number of
incomplete projects a bit higher in the hills above Santa Monica and Hollywood. This is a factor that I will incorporate into the model.
Let's take a look deeper look at two of the possible impediments to ADU construction mentioned in the LA City test project referenced earlier - hillsides and Historic Preservation Overlay Zones (HPOZ). Projects in LA
City's six-month data set that fall in these areas definitely have a lower completion rate than those that do not.
|
Completion Rate |
| HPOZ |
18.5% |
| Hillsides |
14.4% |
| Neither |
29.3% |
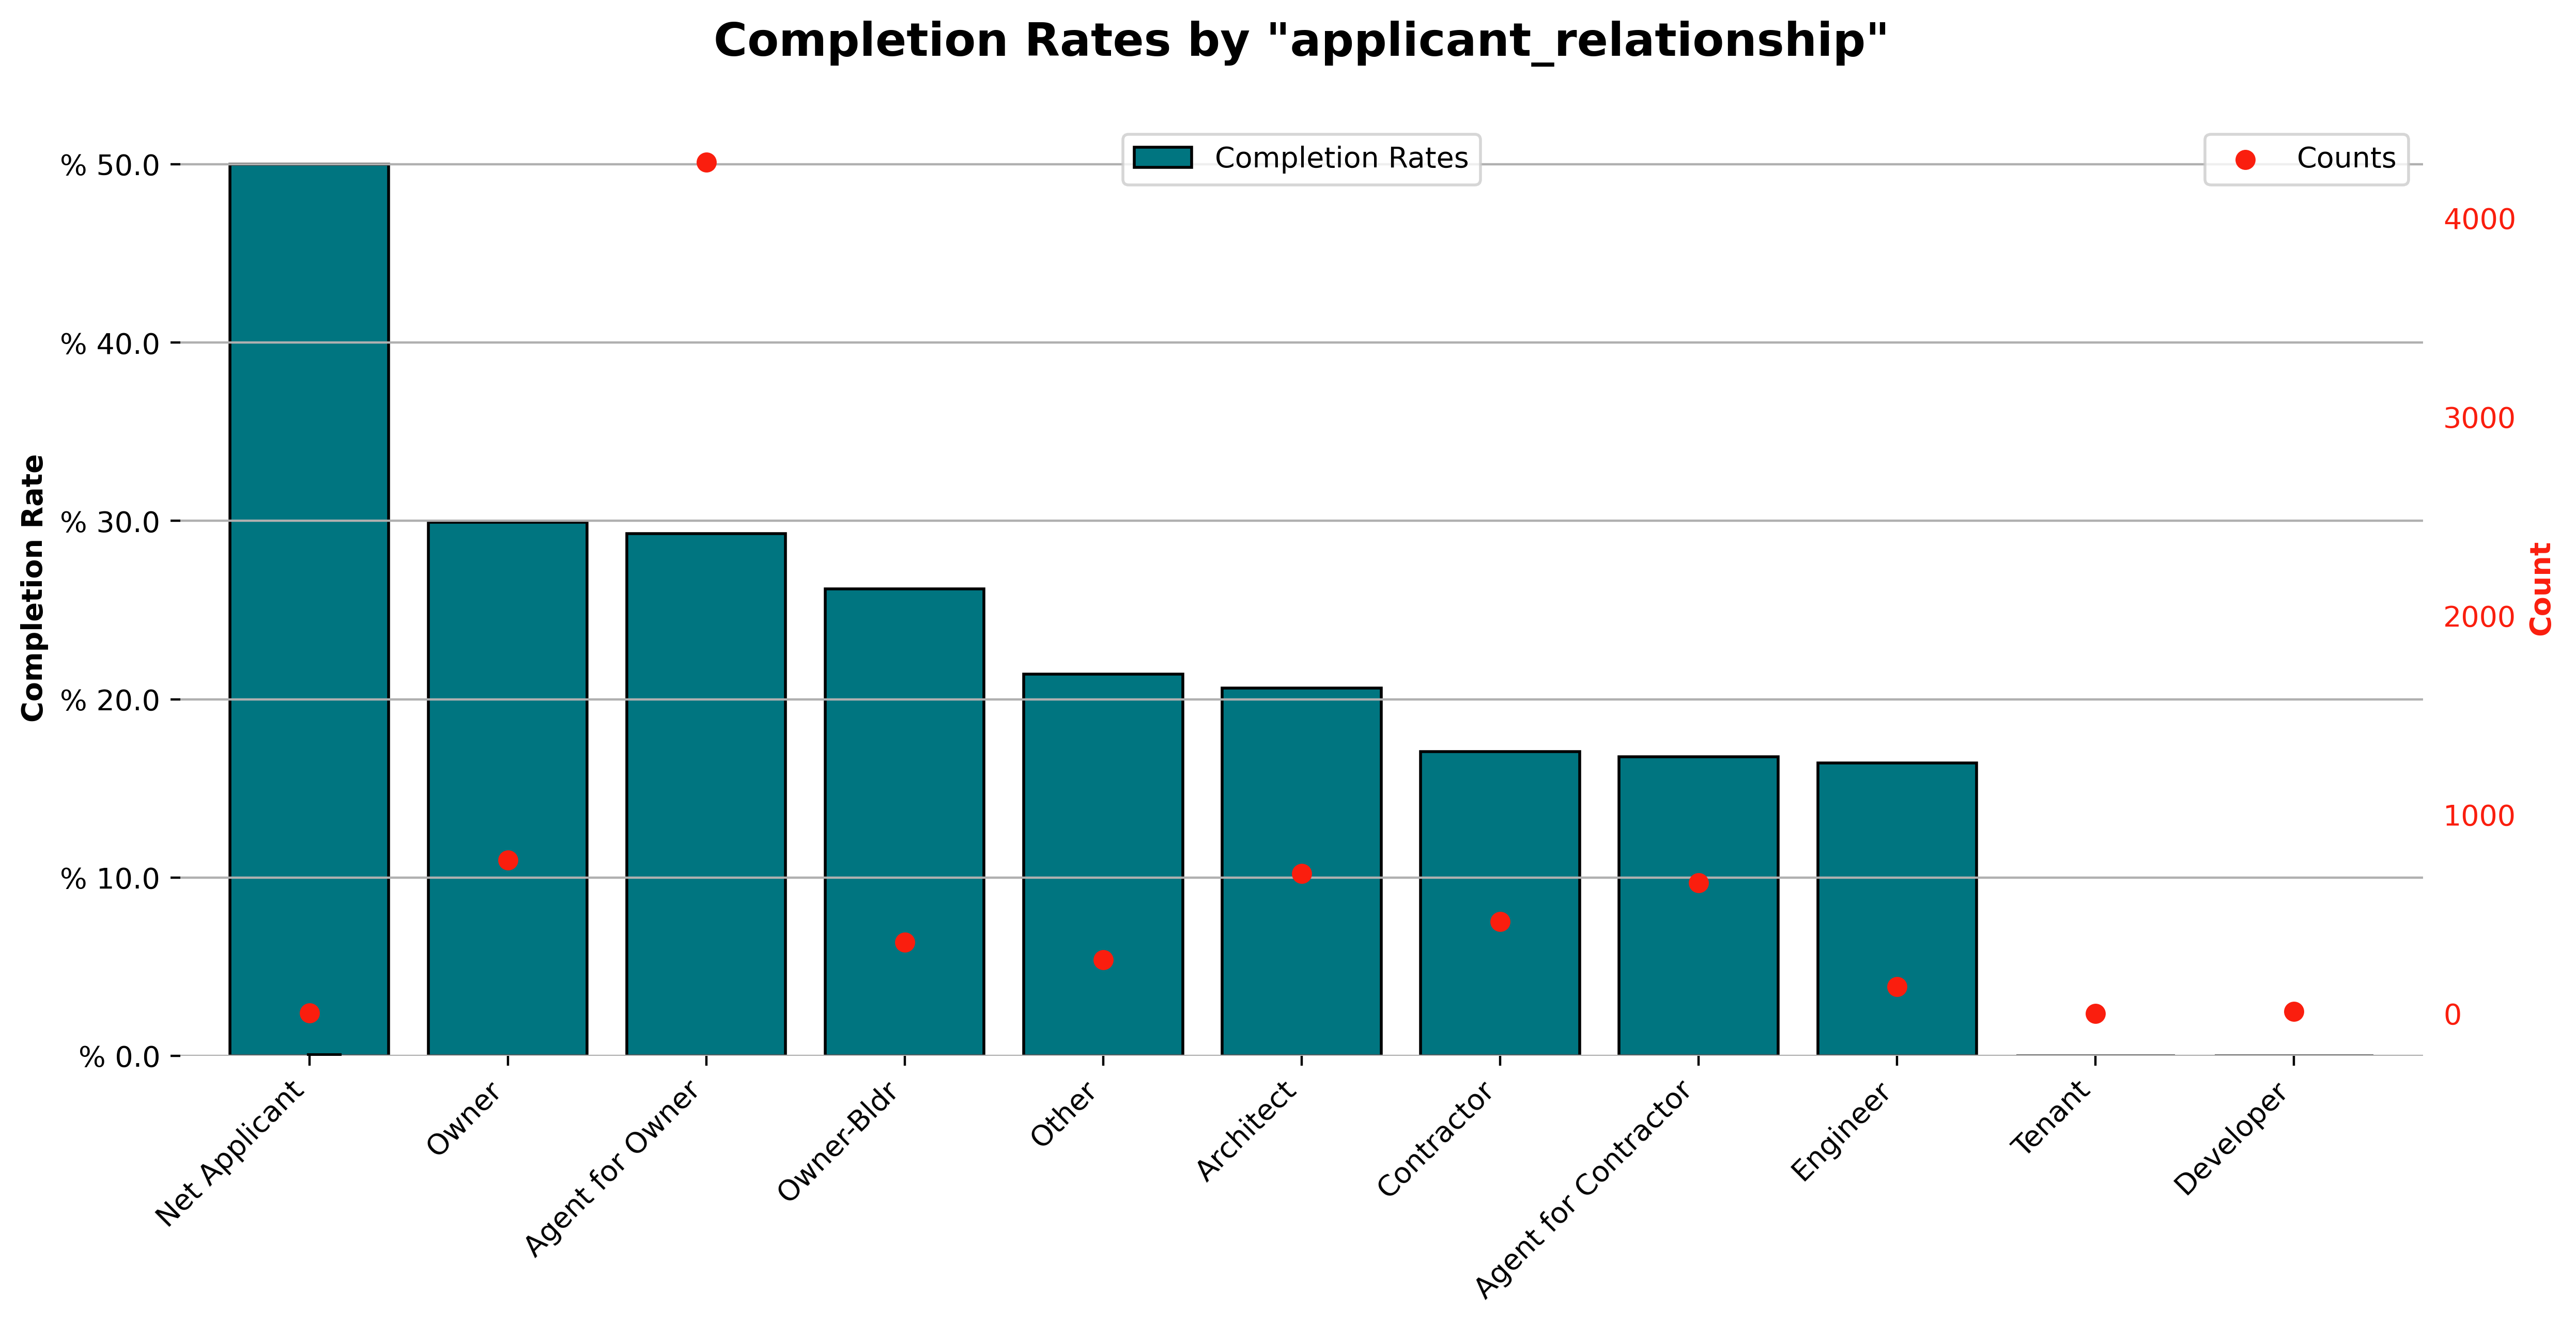
Another aspects of these projects that seem to have a notable difference in completion rate is the permit applicant. An owner or agent for the owner seem to have a higher degree of success at completing an ADU than other types of applicants,
even contractors or architects. This was somewhat surprising to me as I would have thought projects with professional management would have a higher degree of success. (Note that only 2 records have 'applicant_relationship' as "Net Applicant",
so it's 50% completion rate represents one project.)
Analyzing The Predictive Model
Ultimately I distilled the 58 variables in the LA City ADU data set, the parcel size, the median income of the census tract in which the
project was located and whether the project was located in an HPOZ or on a hillside, into a handful of variables. I kept the raw location of each project in the model, as well as a location grouping that I identified via a clustering algorithm.
During the model building process I tested three types of classification models. The random forest model performed the best out of the three, although the predictive accuracy wasn't great. Please refer to my github repository
for this project to delve into the details of the model evaluation.
After completing this exercise I don't think even the best performing model has sufficient strength to make reliable predictions regarding completion for any individual project; however, insights can still be extracted by analyzing the
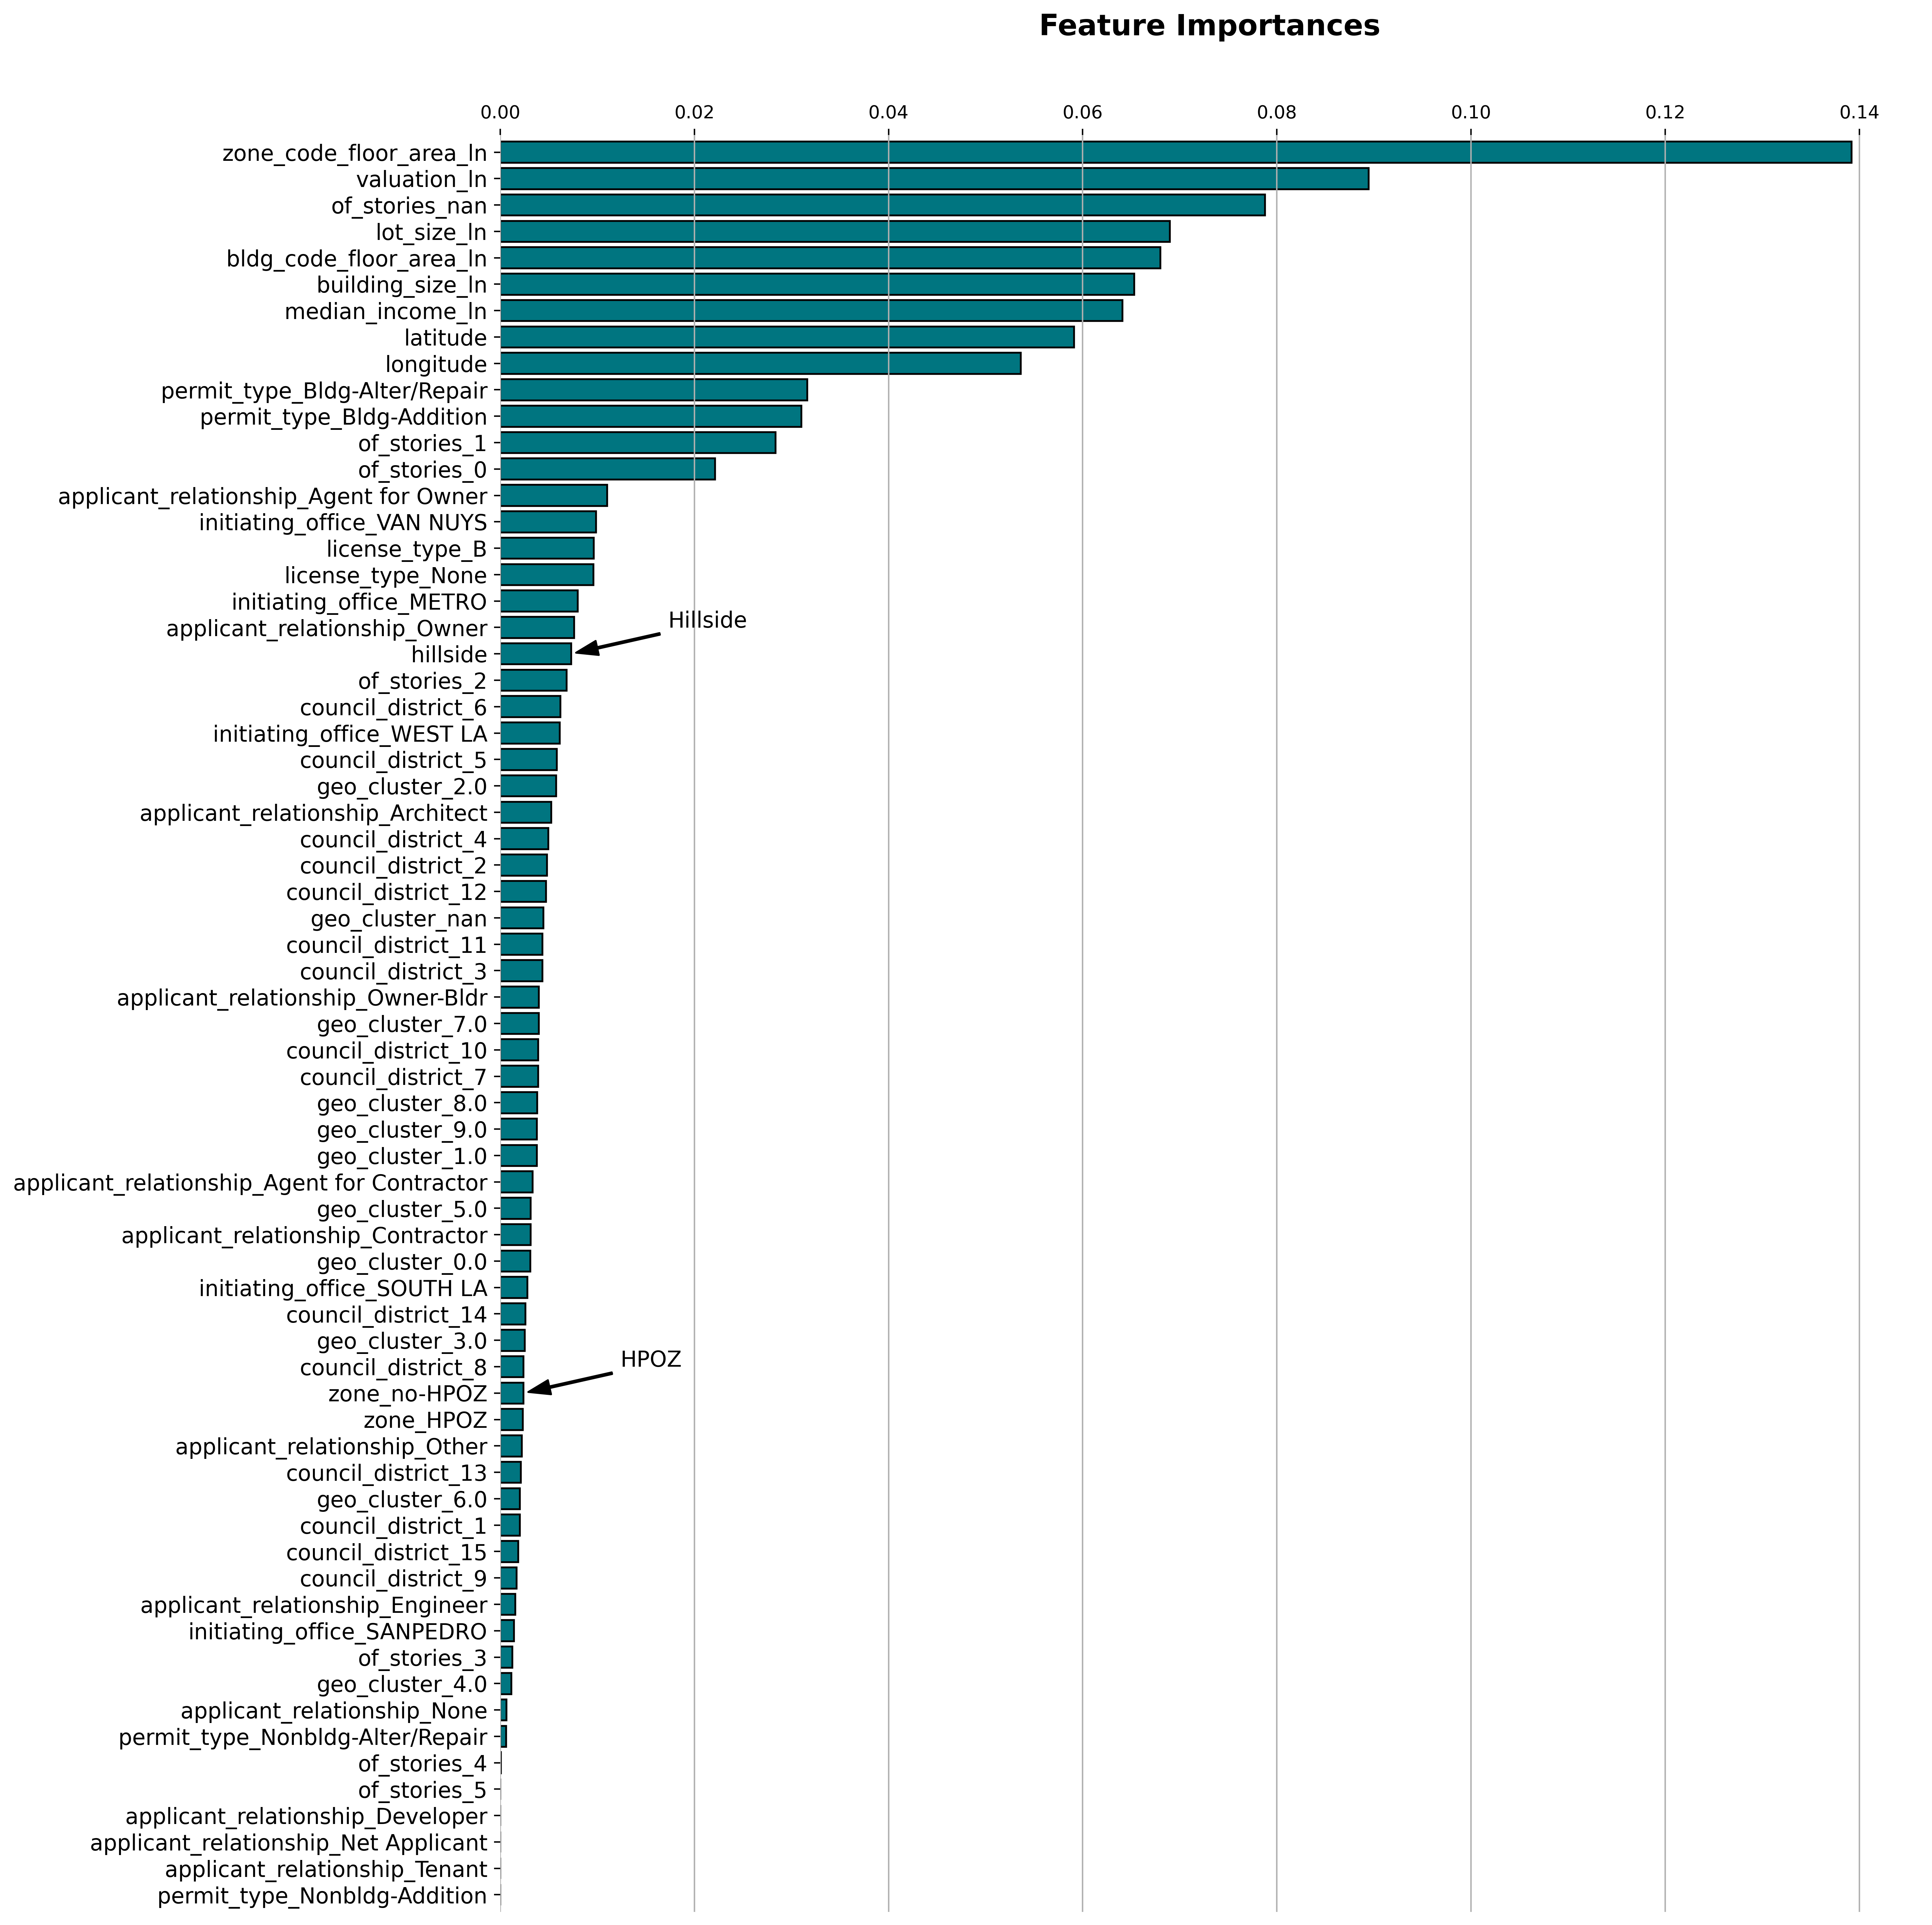
importances of the various model inputs. Returning to the radio segment that started this project off, a historic preservation overlay zone didn't turn out to have a significant contribution to this model, but then it was only 4.1% of
the data set. Hillsides at 21.8% would have had a greater chance at influencing the completion probability, but ultimately other variables were more powerful. Those that rose to the top were mostly "magnitude" variables - floor sizes, lot
sizes, valuations, median income, number of stories. The location groupings don't appear to have significant influence on the probability of completion, but the raw latitude and longitude exhibited some predictive power.
This suggests that the bigger and more expensive the project, the more likely it will be completed within two years from the time the permit is issued or applied for. Another point I'd like to make is that two years is quite a long time. A lot of changes can
happen to a project during that time. Size and scope morph, items are added and deleted, all of which affects the probability of completion. Seeing the results of this model is causing me to form a new theory
regarding the completion rates of ADU's once permitted. If the owner of the site gets as far as obtaining a permit to build, they are already committed to the project. Given sufficient resources the owner will probably overcome the project's
challenges.
With the goal of making the permitting process easier, the City of Los Angeles recently launched the ADU Standard Plan Program. This
program provides homeowners with the option of choosing an ADU design from a selection of pre-approved plans, thus reducing the permitting time from weeks to days. The designs have been created by various different companies and come in a
range of styles and sizes. It will be interesting to see if this program not only reduces the permitting time but also increases the likelihood that a project, once permitted, will be completed.
